This PDF Kept Every Pixel and Still Came Out Looking Worst
Compress a PDF and the obvious way to check what happened is to look at the resolution of the images inside. It is the number every tool reports and the one every comparison uses. It is also, on its own, close to useless — here is a file that kept every single pixel at full resolution and looked worse than one that threw three quarters of them away.
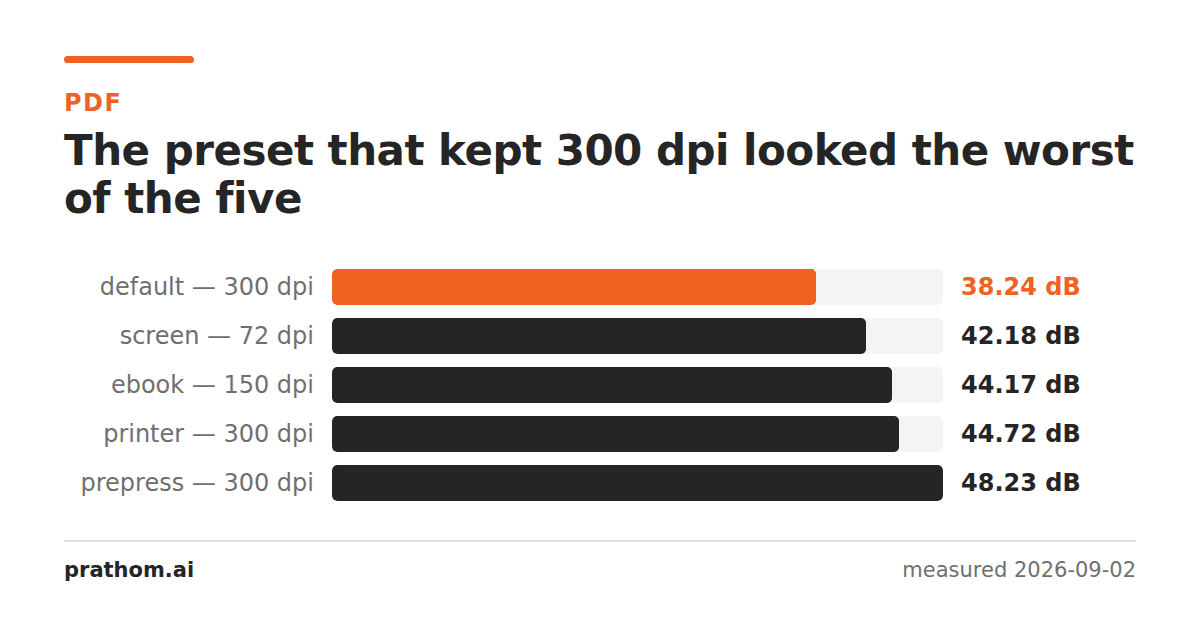
Five compressed versions of the same PDF. The third column is what a tool reports. The fourth is what the page actually looks like, measured by rendering both the original and the output at 150 DPI and comparing them.
| preset | size | image resolution | rendered quality |
|---|---|---|---|
/default | 183,505 B | 1600×1200 @ 300 dpi | 38.24 dB |
/screen | 229,024 B | 384×288 @ 72 dpi | 42.18 dB |
/printer | 364,945 B | 1600×1200 @ 300 dpi | 44.72 dB |
/prepress | 577,633 B | 1600×1200 @ 300 dpi | 48.23 dB |
/defaultand /screenare the interesting pair. By resolution, /defaultis the
conservative one: it kept every pixel while /screenthrew away 94% of them. By
appearance, /defaultis the worst of the four and /screenbeats it.
How both can be true
An image inside a PDF has two independent properties, and compression tools adjust both.
How many pixels there are. Downsampling reduces this. It is what /screendid,
cutting a 1600×1200 image to 384×288.
How accurately each pixel is stored. The images inside a PDF are usually JPEG, and JPEG has a quality setting. Lowering it keeps every pixel and makes each one less accurate.
/screentook the first lever hard and the second gently. /defaultleft the first
alone and took the second hard. The result is a file that reports full resolution and
is full of JPEG artifacts — blocking, ringing round every edge, mottling in flat
areas — at a resolution high enough to show them clearly.
Why this trips up comparisons
Resolution is easy to check and quality is not. pdfimages -listprints the
dimensions of every embedded image in a second. Measuring appearance means rendering
two documents to bitmaps and comparing them, which needs a second tool and a
reference file.
So comparisons check the easy number, and the easy number is the one a preset can
preserve while ruining the page. Every "which PDF compression setting is best"
article that stops at the dimensions is measuring the wrong thing, and it will
recommend /defaulton the strength of a small file that kept its resolution.
The same trap outside PDFs
This is not specific to Ghostscript. It appears anywhere a pipeline reports a dimension and not a fidelity.
Video. "1080p" says how many pixels per frame and nothing about the bitrate. A 1080p stream at 800 kbps looks worse than a 720p stream at 3 Mbps, and both report their resolution proudly in the interface.
Audio. "44.1 kHz, 16-bit" describes the sample format of an MP3's output, not how much was thrown away to make it. A 64 kbps MP3 and a 320 kbps MP3 both decode to 44.1 kHz 16-bit.
Images. A 4000×3000 JPEG at quality 20 has twelve megapixels and looks like mud. The megapixel count is a property of the grid, not of what is on it.
The pattern is the same each time: the dimension is a property of the container and the quality is a property of the contents, and only the first one is easy to print.
What to check instead
Render it and look. This is not a joke answer — for a document you are about to send, opening the compressed version at 100% and scrolling through it takes a minute and catches everything a number would.
Compare renders if you need it repeatable. Render the original and the output at the same density and difference them:
pdftoppm -png -r 150 -f 1 -l 1 -singlefile original.pdf a
pdftoppm -png -r 150 -f 1 -l 1 -singlefile compressed.pdf b
magick compare -metric PSNR a.png b.png null:
Higher is closer. Anything above about 45 dB is generally indistinguishable at normal viewing size; below 40 dB you will see it on flat areas and edges.
Check both numbers, not one. pdfimages -listfor what was downsampled, the
render comparison for what it looks like. Either alone will mislead you, and they
mislead in opposite directions.
What the two numbers each tell you
Once you are reading both, they answer different questions and it is worth knowing which is which.
The resolution tells you what is recoverable. Pixels that were downsampled away are gone permanently. If a scan was reduced to 72 DPI, nothing later can bring back the detail, and the document is now unsuitable for printing, for OCR, and for anyone who wants to zoom in on a figure. This is the destructive, one-way number.
The rendered quality tells you what is visible now. JPEG artifacts at full resolution are ugly and they are, in a sense, less final: the pixels are still there, the page can still be printed at size, and a future re-compression from the original would fix it. It is worse to look at and less damaging to the underlying record.
Which matters more depends entirely on the document's job. For an email attachment that will be read once on a laptop, visible quality is everything and resolution is almost irrelevant. For a scanned contract going into an archive, the resolution is the thing you cannot get back, and some visible compression noise is an acceptable price.
A note on comparing your own files
If you do run the render comparison, use the same density for both sides and pick one high enough to expose the problem. Rendering at 72 DPI would have hidden most of the difference between these presets, because at that size the artifacts are smaller than a screen pixel. 150 DPI is a reasonable default: high enough to show compression noise, low enough to be quick on a long document.
And compare page by page rather than as a whole. A document is usually spoiled by a few pages — the ones with photographs or diagrams — while the text pages are untouched. An average across forty pages hides exactly the pages you would have wanted to look at.